Stepwise Process Flow Details
-
Step 1: Determine the Building Typology
The first step involves examining the building data you've collected. If the data includes information on building typology, you can use this to identify all buildings with 'kutcha' construction - a term used in South Asia to refer to buildings made from materials such as mud, thatch, or bamboo. These structures are typically associated with economically vulnerable households.
-
Step 2: Use Slum Boundaries
If the building typology data is not available, you can use slum boundaries as an indicator of economically vulnerable settlements. Slums are often characterized by overcrowded and inadequate housing conditions and can be an indicator of economic vulnerability. If you have this boundary data, overlay it onto your existing map in the GIS software.
-
Step 3: Conduct Overlay Analysis
Having established the criteria for economic vulnerability (either kutcha construction or location within slum boundaries), perform an basic overlay analysis by using the tool, ‘select by location’ in QGIS software.
-
Step 4: Categorize Buildings
The final step is to categorize the buildings or settlements identified through the overlay analysis as 'Economically Vulnerable Settlements'. This can be done by creating a new field in the attribute table of the building layer and assigning these buildings with a specific tag or code.
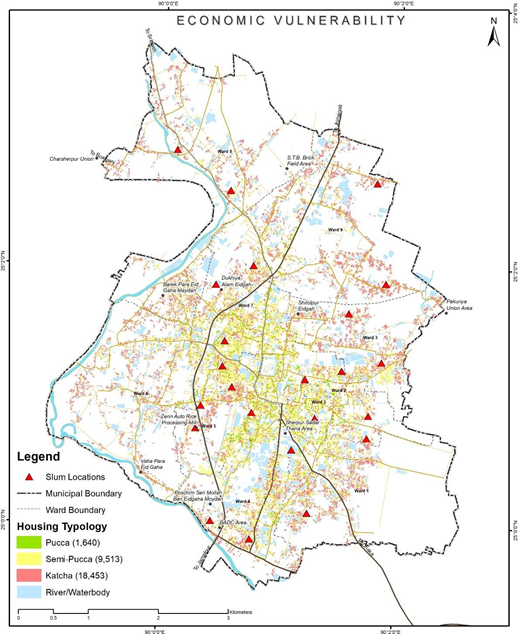

Figure 11 Illustrations for identifying economic vulnerable settlements, Sherpur (Bangladesh)
Source – CWIS spatial analysis, Innpact Solutions and GWSC
No Comments