Urban Management DSS
UMDSS is a core tool within IMIS, offering spatial analysis, mapping, data export, and dashboard visualizations to support evidence-based planning, management, and monitoring of sanitation systems, services, and broader urban management activities.
In addition to the UMDSS module, several IMIS components are integrated into UMDSS, including:
- IMIS Dashboard
- Building Dashboard (BIMS)
- FSM Dashboard (FSIMS)
- Utility Dashboard (IMIS)
- CWISIMS Module, which includes the CWIS and KPI dashboards
These tools collectively enhance decision-making, urban management, and service delivery monitoring.
- Urban Management DSS Introduction
- 18.1 Export Data
- 18.2 Map Feature
- 18.3.1 General Tools
- 18.3.2 Layers TAB
- 18.3.3 Tools TAB
Urban Management DSS Introduction
The UMDSS is one of the core and powerful tools in IMIS, it provides advanced capabilities for spatial analysis, mapping, data export, and dashboard visualizations. These tools empower city authorities to engage in evidence-based planning, management, monitoring, and decision-making for planning, management and monitoring and evaluation of sanitation system and services as well as a broader municipal urban management activity. In addition to the UMDSS module, there are IMIS Dashboard, Building Dashboard under BIMS, FSM Dashboard under FSIMS, Utility Dashboard of IMIS, CWISIMS Module including CWIS and KPI dashboard under CWISIMS are also has been considered as the components of UMDSS.
The UMDSS provides Export Data and Map Feature Sub-modules.
Export Data:
§ The Export Data sub-module enables users to export data layers in flexible formats such as SHP and KML. Users can customize exports by selecting specific ward(s) or combining layers to suit their needs.
Map Feature:
§ The Map Feature is a powerful interactive map interface which provides a dynamic platform to visualize and analyze spatial data created by various modules and sub-modules in IMIS. It displays all spatial information with categorical styling based on attribute information, presenting summarized layers at city, ward and 0.5 km grid levels.
§ The interface includes various spatial and complex tools that provide both basic and advanced functionalities, catering to a wide range of municipal operations. From navigation and visualization to sanitation-specific analyses and data updates, these features enhance decision-making by offering precise and actionable insights. These tools are – (i) Navigation and Map Interaction Tools (Zoom In & Zoom Out, Municipal Extent, Navigate, Info, Coordinate Information, Locate Point by Coordinate, (ii) Measurement Tools (Measure Distance, Measure Area), (iii) Printing and Support Tools (Print Map, Help), (iii) Sanitation-Specific Analysis Tools (Find Nearest Road, Find Building Connected to Containment, Find Containment Connected to Building, Find Associated Building, (iv) Editing Tools (Add Roads, Remove Markers).
The integration of tools like Find Nearest Road and Containment Analysis directly supports Citywide Inclusive Sanitation (CWIS) goals, while features like Measure Area, Print Map, and Add Roads contribute to broader urban management and planning efforts. By using these tools, municipal authorities can efficiently monitor sanitation systems, plan infrastructure upgrades, and ensure equitable service delivery across the city.
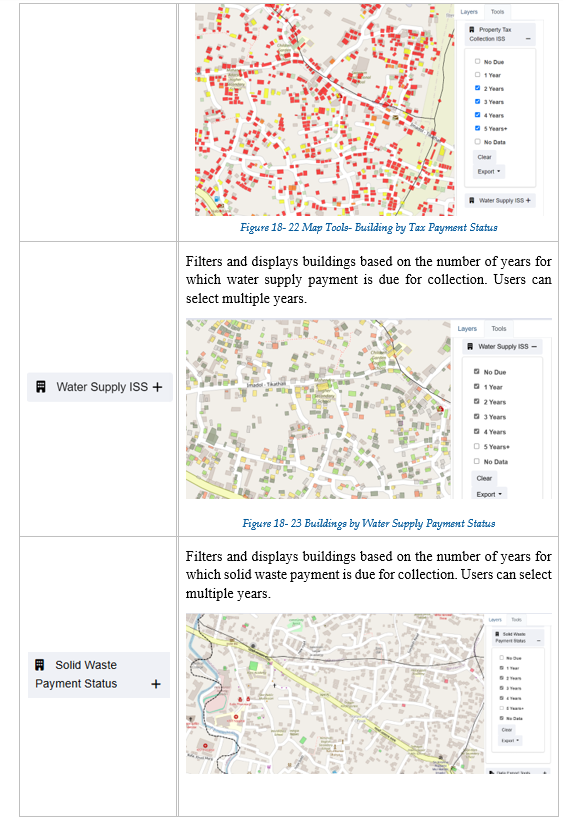
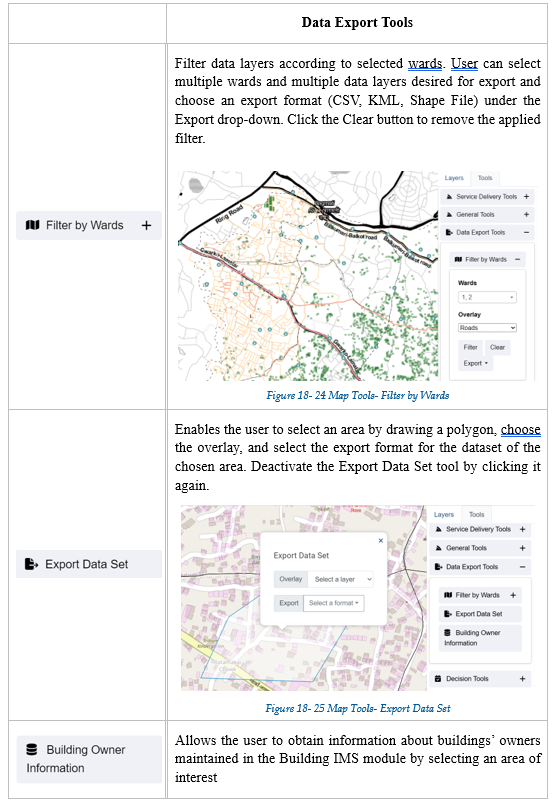
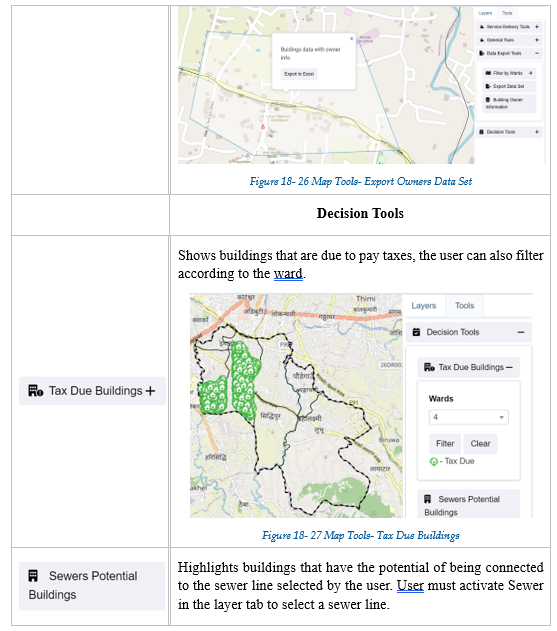
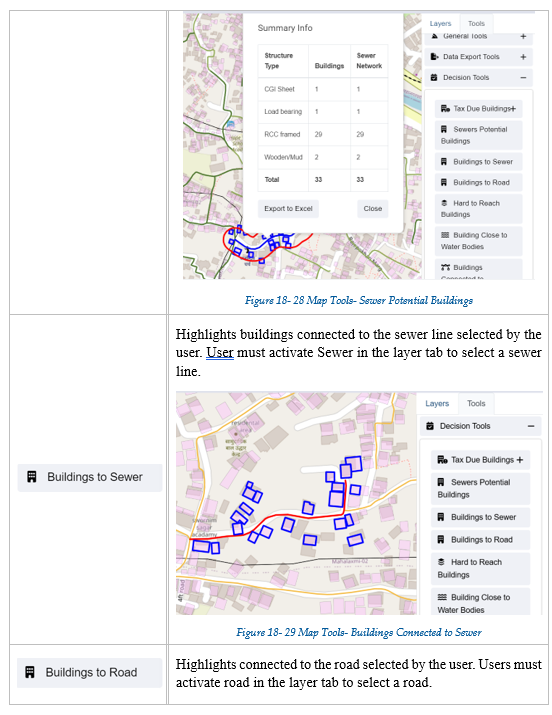
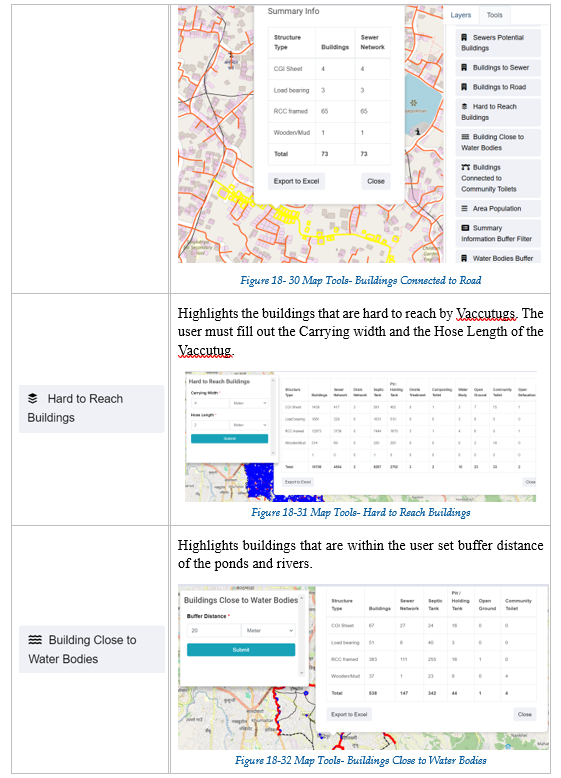
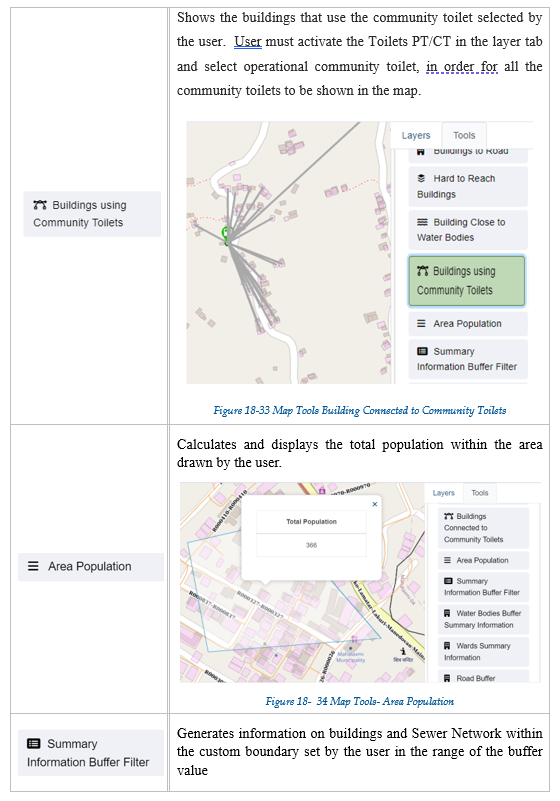
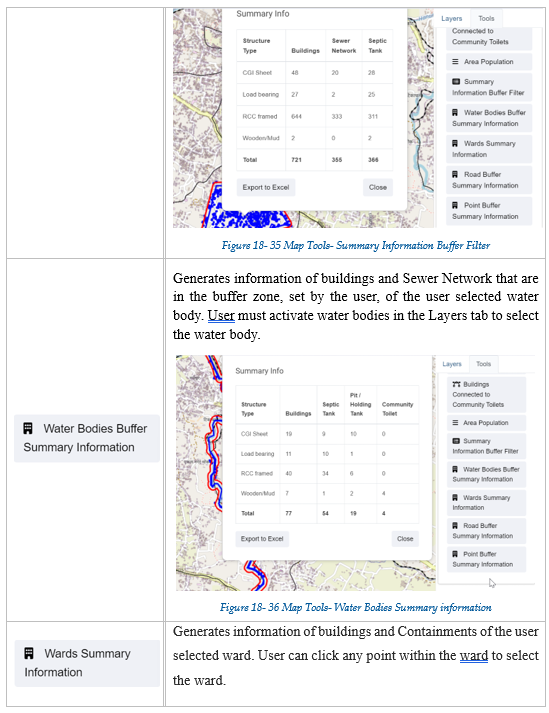
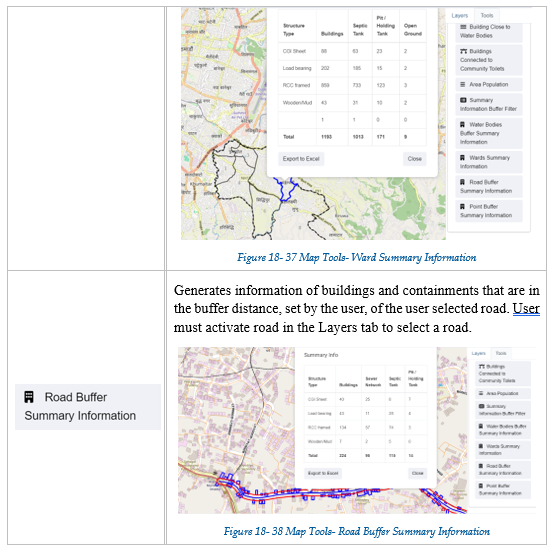
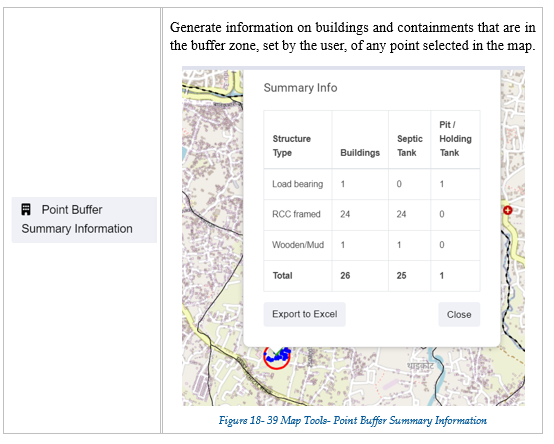
§ UMDSS also offer some specialized tools – (i) Service Delivery Tools for tracking (Applications, Emptied Applications Not Reached to Treatment Plant, Containments Proposed to Be Emptied, Feedback Chart (FSM Service Quality), (ii) General Tools for tracking (Buildings by Structure Type, Property Tax Collection, Water Supply), (iii) Data Export Tools (Filter by Wards, Export Data Set, Building Owner Information), (iv) Decision Tools (Tax Due Buildings, Sewers Potential Buildings, Buildings to Sewer, Buildings to Road, Hard to Reach Buildings, Building Close to Water Bodies, Buildings Using Community Toilets, Area Population), (V) Summary Information Tools (Summary Information Buffer Filter, Water Bodies Buffer Summary Information, Wards Summary Information, Road Buffer Summary Information, Point Buffer Summary Information).
These tools enhance decision-making by providing targeted insights into property, utility, and demographic data. They allow municipalities to analyze specific areas, prioritize interventions, and support efficient planning, management and monitoring and evaluation of CWIS sanitation system and services, and overall urban management.
18.1 Export Data
All data layers stored in the IMIS system are available for export. There is an option to export layers within a specific ward. Layers can be exported in either a shape file or a KML file. This module supports further planning and analysis outside the IMIS system. Any GIS software can be used to view exported shape files. KML files can be easily viewed on Google Earth.
· Open the sidebar and click on ‘Urban Management DSS’.
· Select the Export Data.

· This redirects to the Export to Shape File or Kml page.
Overview:
· Fill out all the required fields.
· Enter a specific data layer that the user is interested in exporting. The checklist available in the Layers filter is not mutually exclusive, therefore the user has the option of selecting all layers, a specific data layer, or multiple data layers.
· Choose a desired spatial Filter between Wards. Depending upon the chosen spatial Filter, the user is provided with an option to select Wards. The checklist available in the Wards filter is not mutually exclusive, therefore the user can select more than one Wards if desired.
· Choose a desired export format between the Shape and KML files. A zipped file will be downloaded when the shape file is chosen.
· Click on the ‘Download’ button.

Figure 18- 1 Export to Shape File or KML file page
18.2 Map Feature
This is the main graphical web interface of IMIS where spatial visualization of data layers and other spatially assisted decision-making processes will be performed.
· Open the sidebar and click on the Urban Management DSS to expand.
· Select the Map Feature.

· This redirects to the main section of Map Interface (refer to Figure 18-2).
- The map has four main sections: General Tools, Map, Layers Tab, and Tools Tab.

Figure 18- 2 Map
18.3.1 General Tools
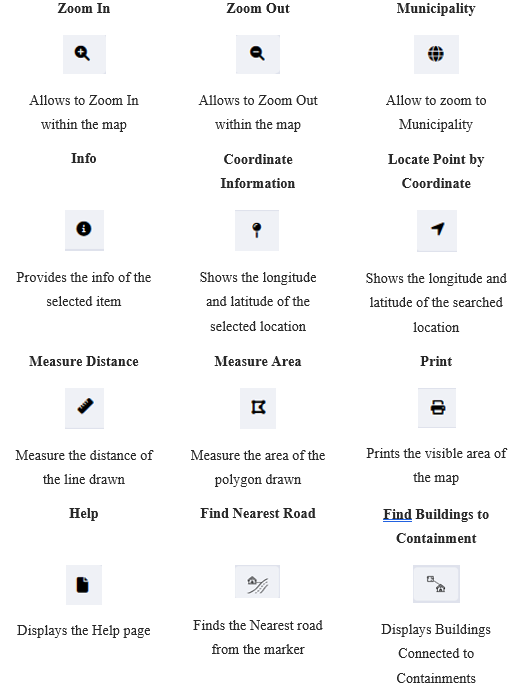
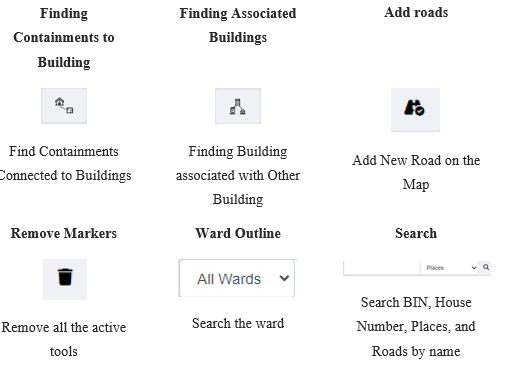
General tools and search functionality are on the header (in the page upper part). These tools are mainly for navigating around the map and performing basic operations e.g., measuring, printing, searching based on House Number, BIN, Places and Roads.
Table 18- 1 General Tools Available on IMIS Web Map
a) Info
· Zoom to an area of interest using navigation tools such as Zoom In, Zoom Out & Navigate (Pan).
· Click on Info to activate it.
· A pop-up containing a list of layers is displayed.
· Select the desired layer and then click at the desired point location of interest.

Figure 18- 3 Map Info
Overview:
· Users can see the Attributes and Corresponding Values of the desired layer.
- This tool displays detailed attribute information of the selected layer at the point clicked on the Map. If there are no data layers at a clicked point, no information will be returned. Information will be displayed at the bottom of the map.
b) Coordinate Information
· Zoom to an area of interest using navigation tools such as Zoom In, Zoom Out, and Navigate (Pan).
· Click on the ‘Coordinate Information’ tool to activate it.
· Click on the ‘Coordinate Information’ tool to deactivate it.
· Click on a location on the map to get coordinate information of that clicked point.

Figure 18- 4 Coordinate Information
Overview:
- This tool will provide coordinate information of a clicked point on a map. Coordinates information is provided in two coordinate systems (EPSG: 3857 & EPSG: 4326).
c) Locate Point by Coordinate
· Activate the tool by selecting it.
· Fill in the necessary longitude and latitude information on a point of interest.
· Click on the Search button and the point is located on the map.

Figure 18- 5 Locate Coordinates by Point
d) Measure Distance
· Zoom to an area of interest using navigation tools such as Zoom In, Zoom Out, and Navigate (Pan).
· Click on the ‘Measure Distance’ tool to activate it.
· Click on a location on the map (Start Point of a line) and drag the line appearing on the map to another location (End Point line). Distance information is provided in meters. Double Click to finish.
· Click on ‘Measure Distance’ again to exit the tool.

Figure 18- 6 Locate Coordinates by Point
Overview:
· This tool is useful if the user wants to measure distances on the map. E.g., the user may want to measure how far a building is from a road.
e) Measure Area
· Zoom to an area of interest with navigation tools such as Zoom In, Zoom Out, and Navigate (Pan).
· Click on the Measure Area tool to activate it.
· Click on a series of locations on the map that represent the boundary of an area. Area information is provided in square meters. Double Click to finish.
· Click on Measure Area again to exit the tool.

Figure 18- 7 Maps-Measure Area of Polygon
Overview:
- This tool is useful if the user wants to measure an area in the map.
f) Print
· Arrange a view on the map as desired and turn on/off data layers as desired.
· Activate the Print tool by clicking it.
· A pop-up will appear where the user needs to enter Title and Comments if any on the displayed output.
· The scale chosen determines the size of the bounding box which will encompass the map’s print boundary. The bounding box can be dragged as required.
· The paper size, DPI, and orientation can also be set as desired, then Click Print.

Figure 18- 8 Map Print
g) Find Nearest Road
· Toggle on building, road, and containment layers with an underlying base layer.
· Activate the Find Nearest Road tool.
· Click any point on the map. The nearest Road will be shown with a Marker. Use the Info tool to get information about the Nearest Road, if needed. Use the Measure Distance tool to get distance information between clicked location and the nearest road, if needed.
· Click the Remove Markers tool to get rid of markers from the map.

Figure 18- 9 Maps- Nearest Road
Overview
- User can find the nearest road from the desired location.
h) Find Buildings Connected to Containment
· Activate the tool.
· Select the containment for which user want to search the building for the building found is outlined.
· Click the ‘Remove Markers’ tool to get rid of markers from the map.

Figure 18- 10 Map- Find Buildings to Containments
Overview:
- User can find the Buildings connected to Containment.
i) Find Containments Connected to Building
· Activate the tool.
· Select the building you want to search for the containment.
· The containment is displayed via markers.
· Click the Remove Markers tool to get rid of markers from the map.

Figure 18- 11 Map- Find Containment to Building
Overview:
· User can find Containments connected to a building.
j) Find Associated Buildings
· Activate the tool.
· Select the main building of which you want to find associated buildings.
· The building is displayed via markers.
· Click the Remove Markers tool to get rid of markers from the map.

Figure 18- 12 Map- Find Associated Building
Overview:
· Users can find the Associated Building.
· There can be situations where there are multiple small buildings that serve as auxiliary buildings to the main building. It can be a house-help quarter, guard quarters, or such.
- This tool allows the user to identify all associated buildings of the main building.
k) Add roads
· Activate the add road tool.

Figure 18- 13 Map- Add Roads
- For reference chapter 14.2.2
l) Remove Markers
· Click on the Remove Markers.
· Markers are removed from the map.

Figure 18- 14 Map- Remove Marker
Overview:
· Users can remove markers from the map tools.
- Some of the tools in Tools TAB (e.g., Find Nearest Road) generate temporary Markers for visualization on the map. This tool is used for removing such Markers.
m) Search
· Choose the desired criteria.
· Type a Code based on which building needs to be located on the map.
· Click the Search button.

Figure 18- 15 Map- Search using BIN Code
Overview:
· Users can search specific roads, buildings, and places.
· If the user wants to navigate to a specific location (E.g., specific road, specific building based on Holding No.) in the map, search tools are extremely beneficial.
- The search tool provides a criterion to search for a specific building based on criteria such as BIN, Holding No, Tax Code, Landmarks, or Road code.
18.3.2 Layers TAB
The Layers TAB in IMIS provides a map-based interface where users can visualize information from various modules and submodules. It also allows users to select their preferred base layer (e.g., Google, Bing, OSM) for viewing the map. In the 'Overlays' section of the Layers tab, users can choose specific layers to display on the map. These layers represent data maintained in the various submodules and modules of IMIS and the styles present in the individual dropdowns are based on the attribute information maintained in their respective sub modules. For example, if a user selects the ‘Buildings’ layer, the attributes of the ‘Buildings’ sub module will be listed in the dropdown, and the user can select the attribute they want to visualize in the map. User can also select Summarized Grids layer (0.5 km grid) to view the spatial status of the Municipality based on specific criteria, e.g., No. of Buildings, Wards, etc.
Note: The list of data layers available to a user is government by their login credentials.
· Click the nearby checkbox to toggle ON/OFF a specific data layer.

Figure 18- 16 Visualization of different Layers based on two different criteria
Overview:
· If a data layer has multiple visualization options, a drop-down list will appear.
- Change the options in the list to change visualization based on different attributes of the data layer.
18.3.3 Tools TAB
Tools TAB enlists different specialized tools developed specifically to cater to the needs of various users of IMIS. There are altogether 20 different tools categorized under different headings such as Service Delivery Tools, General Tools, Data Export Tools, Decision Tools, and Summary Information. The availability of tools will be governed by the login credentials of the user.
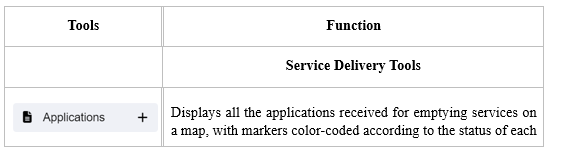
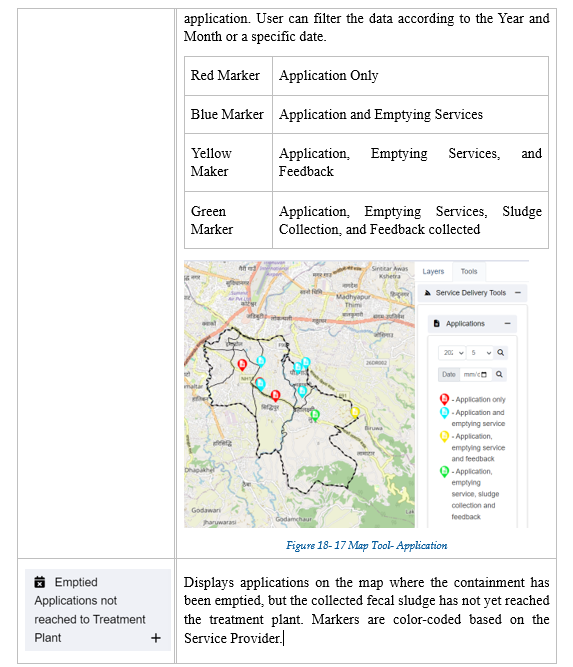
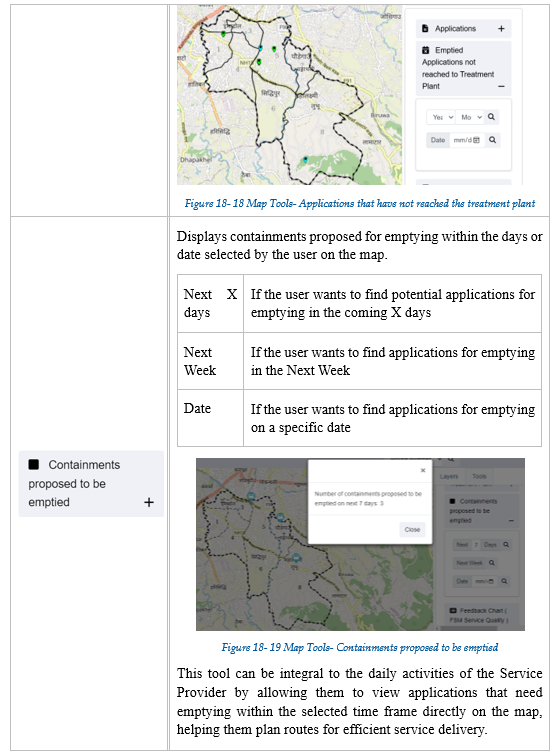
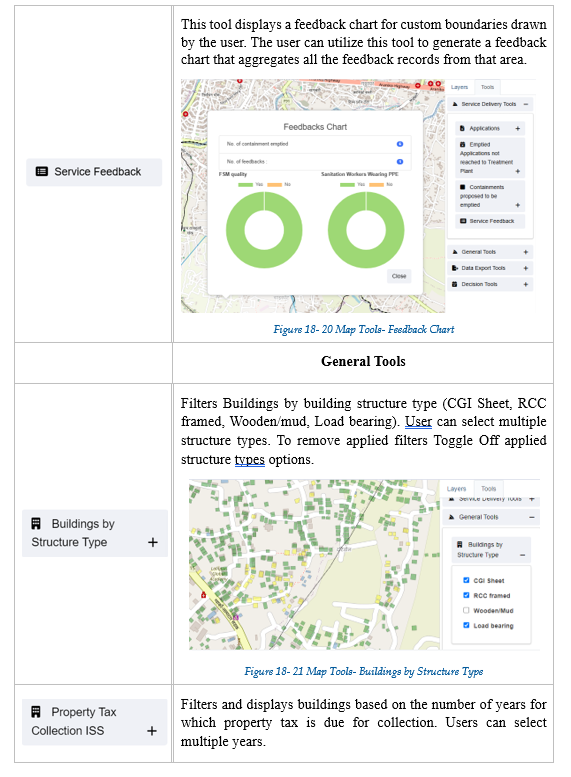
Table 18- 2 Tools